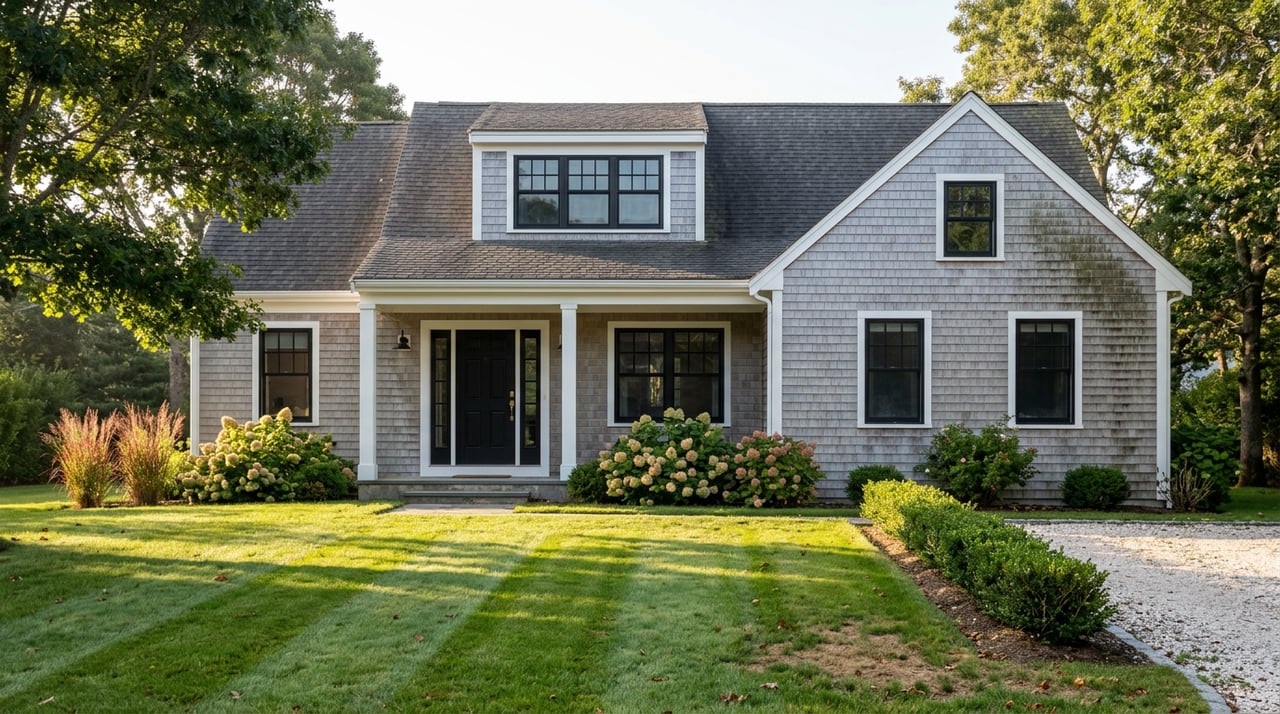
What Cape Cod Median Home Prices Actually Mean by Town
August 20, 2026
August 20, 2026
Two buyers can look at the same number this year, a Barnstable County median sale price sitting around $695,000 in the first quarter of 2026, and walk away from it with completely different plans. One buyer takes that number to Bourne, where the median price per square foot recently sat near $348, and finds a real, if modest, house. The other buyer takes the same number to Provincetown, where price per square foot has run closer to $1,511, and discovers the median doesn't even cover a down payment on what's actually for sale there.
That gap, roughly $1,163 per square foot between the Cape's least and most expensive towns, is the whole story the county median leaves out. Cape Cod is not one housing market wearing a single price tag. It's a string of a dozen or more small, distinct markets that happen to share a bridge, a zip code prefix, and a regional MLS. Anyone comparing towns off a headline number is comparing the wrong thing.
Look at recent single-family sales data covering the six months from mid-November 2025 through mid-May 2026, and the town-by-town spread does more explaining than any single county figure could. Barnstable, the Cape's highest-volume town with 227 units sold in that window, posted a median sale price of $722,000 at roughly $430 per square foot and a median of 36 days on market. Chatham, at the premium end, closed at a median of $1,465,000 and $741 per square foot, with homes moving in a median of 45 days. Falmouth, the Cape's volume-and-value town, sold 184 homes at a median of $777,500 and $449 per square foot, with a median of just 26 days on market.
Those aren't small variations on a theme. They're different markets operating under different rules, with different buyer pools showing up for different reasons.
The spread between Provincetown's price per square foot and Bourne's tells you more about Cape Cod real estate than the county median ever will.
Here's how several Cape towns compared over that same six-month window, using median sale price, price per square foot, and median days on market as the three numbers that actually distinguish one town's market from another:
| Town | Median Sale Price | Price per Sq Ft | Median Days on Market |
|---|---|---|---|
| Bourne | (lower end of Cape range) | ~$348 | longer, more room to negotiate |
| Barnstable | $722,000 | ~$430 | 36 |
| Falmouth | $777,500 | ~$449 | 26 |
| Harwich | $760,000 | ~$471 | 29 |
| Dennis | (mid-range) | not reported | 14 |
| Dennis Port | (mid-range) | not reported | 11 |
| Chatham | $1,465,000 | ~$741 | 45 |
| Provincetown | (highest on Cape) | ~$1,511 | not directly reported |
| Outer Cape overall | $886,250 | not reported | 93 |
Harwich is worth pausing on. At $760,000 median and $471 per square foot, it sits comfortably in the middle of the pack, but its 90 sales over six months and steady 29-day pace point to something the number alone doesn't say: this is a town that blends mid-Cape convenience, particularly around Harwich Port, with a reputation for stability that keeps both primary buyers and second-home buyers coming back.
The town-level numbers already complicate the county median. Drop down one more level, into Barnstable's own villages, and the range gets wider still. Barnstable is really ten separate villages sharing one town name, and recent per-square-foot medians reported across those villages illustrate the point:
Reported village-level figures put the full spread from the bottom of that table to the top at roughly $451 per square foot, all inside a single town. That's a bigger swing than the gap between some entire Cape towns. A buyer using the Barnstable town median to plan a purchase, without knowing which village they're actually shopping in, is working from a number that describes almost nothing about their actual options.
The instinct is to read a short days-on-market number as a hot market and a long one as a soft one. Recent Cape data argues against that shortcut.
Dennis and Dennis Port have been the fastest-moving markets on the Cape, with Dennis closing a median of 121 sales in just 14 days and Dennis Port moving 40 sales in a median of 11 days. Brewster wasn't far behind at 15 days. These are towns where a fairly priced home gets snapped up before it has time to sit.
At the other end, Osterville, Cotuit, and Wellfleet have recently carried noticeably longer timelines, and the Outer Cape as a whole has averaged around 93 days on market at a median price of $886,250. The instinct is to read that as weak demand. It isn't. These are towns with a smaller, more selective, more lifestyle-driven buyer pool and genuinely limited inventory. Sellers there aren't waiting because nobody wants the house. Buyers are waiting because the right house doesn't come up that often, and when it does, they take their time deciding. Falmouth and Sandwich sit in a different lane entirely: strong volume paired with a 23 to 26 day pace means correctly priced listings there are finding buyers within a month, a pace closer to what buyers expect from a mainland suburban market than a coastal one.
The takeaway for anyone comparing towns is that days on market measures the shape of demand, not its strength. A slow market and a weak market are not the same thing on Cape Cod, and mistaking one for the other is an easy way to misprice an offer in either direction.
One more mechanism worth understanding before comparing towns: not every Cape market runs on the same rules for owners. Chatham, the Cape's premium anchor town with a recent median sale price of $1,465,000, has one of the highest homeownership rates on the Cape at 88.3 percent, a figure driven largely by cash-heavy retirees, high-income remote workers, second-home buyers from Boston and New York, and long-standing family owners. Local commission analysis has found that affordably purchasing a median-priced Chatham home requires household income above $350,000 a year, against median household incomes in the $79,000 to $88,000 range across the Lower Cape.
Starting in fiscal year 2027, Chatham is introducing something new: a 35 percent residential tax exemption specifically for year-round, owner-occupied homes, approved under the state's Affordable Homes Act, which allows municipalities that qualify as seasonal communities to offer exemptions up to 50 percent. Based on Chatham's average assessment of roughly $1.6 million, that exemption reduces taxable value by about $574,000 for qualifying primary residences, a real, quantifiable shift in the ownership math for anyone deciding whether a Chatham purchase will be a full-time home or an occasional one. It's the kind of policy detail that never shows up in a median price and matters enormously to the two people most likely to be comparing that exact tradeoff.
If you're weighing that same primary-residence-versus-second-home question anywhere else on the Cape, our guide to planning a second home purchase walks through the financing, insurance, and seasonal-use questions that come with buying a place you won't occupy year-round.
For broader context on how the region got here, the Massachusetts Executive Office of Housing and Livable Communities has published a Cape Cod housing snapshot covering seasonal conversion trends and long-term supply projections, and the Cape Cod Commission's regional housing market analysis breaks down obtainability by income level across the Upper, Mid, Lower, and Outer Cape. Barnstable County's median single-family price has climbed from $433,000 in 2019 to $789,500 by the end of 2025, a trajectory tracked over time by Data Cape Cod, the kind of long view that's easy to lose inside any single quarter's headline number.
Does a lower price per square foot mean a town is a worse place to buy? Not on its own. Bourne's lower per-square-foot pricing compared to Provincetown reflects a different kind of market, not a lesser one. It often means more entry-level inventory and a different buyer profile, not a warning sign.
If a house sits on the market for 90 days, does that mean I can negotiate hard? It depends entirely on which town. In the Outer Cape's slower-moving, lifestyle-driven markets, a longer timeline often reflects thin inventory and picky buyers rather than a seller desperate to move. In a fast-clearing town like Dennis, a listing that lingers past two weeks is a much clearer signal that something about the price or the property needs a second look.
Will other Cape towns follow Chatham's lead on tax exemptions for year-round owners? That's a legitimate question given the state's Affordable Homes Act extends the option to any municipality that qualifies as a seasonal community, and Barnstable County towns with seasonal vacancy rates above 35 percent are eligible to consider it. Whether a given town adopts it is a local decision worth checking on directly with that town before assuming the exemption applies.
If you're comparing Cape Cod towns and want help translating a listing sheet into an actual read on price per square foot, pace, and what a given town's numbers really mean for your situation, reach out to the team at North New England Real Estate Group. Contact us for a free local market consultation and home valuation, and we'll walk through the specific towns and villages you're weighing side by side.
Stay up to date on the latest real estate trends.


We'd love to hear from you! Whether you're buying, selling, or just exploring your options, we're here to provide answers, insights, and the support you need. Contact us and start planning your next move.